Trader Dan's Market Views
Market Insights and News
Saturday, March 15, 2014
Gold Price vs Hedge Fund Activity
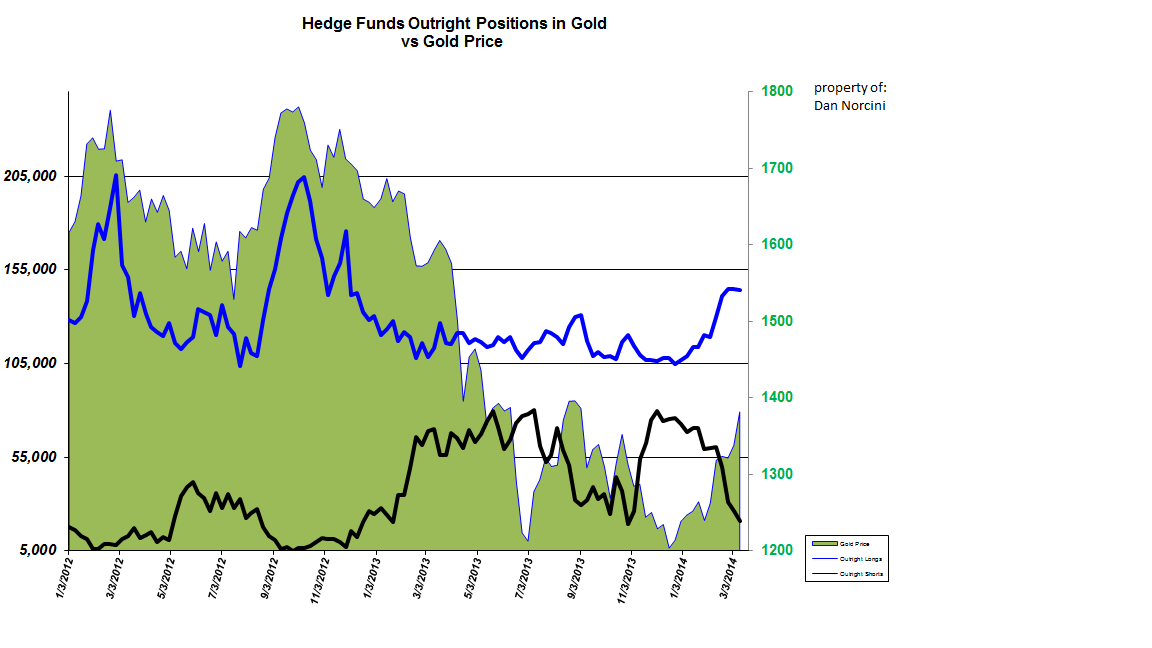
It took a bit of doing but I have been able to create a chart of the price of gold overlaid against the activity of the big hedge funds based on the Commitment of Traders report.
I present it here for your reading convenience. The
blue line is the number of OUTRIGHT LONG positions among this group of traders. The
black line is the number of OUTRIGHT SHORT positions. The area chart (
in green) is based on the CLOSING PRICE of gold for the week ( please note that this is not a daily chart).
Notice the near perfect symmetry of the green area chart ( the gold price at the Comex) with the blue line. This is why I keep stating that the
big speculators ( hedge funds) are the drivers of our modern markets. You can see the price of gold has tended to rise and fall with that blue line until early in 2013.
About that time, the number of short positions by the hedge funds because to increase as this category of traders became increasingly bearish. The wholesale long liquidation halted at that time as well. From that point forward, the blue line is relatively flat.
However the gold price continued to fall. Why was that? Answer - because the hedge funds began to play gold more from the short side as they ramped up the number of outright short positions to its largest point in over a decade. That selling took the price of gold down below $1200 at one point ( remember this is a weekly closing price).

In July of 2013 an enormous
short covering rally took the price of gold up over $200 from off the low. Can you see the sharp fall in the BLACK LINE and the corresponding rise in the green area?
Then look at what happened - the price of gold began to fall again but this time around it was mainly due to hedge fund long liquidation ( see the sharp drop in the blue line). Shorts were covering into that long liquidation and that is why the black line moved lower along side of the gold price.
Then in November of last year, the hedge funds began aggressively shorting gold again ( the black line rises sharply) with the result that the price dropped well over $150 into the end of the year.
Now look at what has happened this year... look at that black line and see it plummet. Look also at the blue line and see it jump. Hedge funds are both covering shorts aggressively while some in that same category are rebuilding longs. The result has been to push the gold price up nearly $200 once again.
Please note that this has everything to do with money flows ( money flowing into and out of gold) and nothing to do with price manipulation theories. When specs are buying, the price rises. It does not matter whether the buying is coming from short covering or from new buying - the price will rise.( The longevity of that price rise is however dependent on the nature of that buying - but that is a different topic -
Friday, March 14, 2014 Hedge Fund Short Covering in Gold is the Story-).
When specs are selling, the price will fall.
What you see reflected in these two lines, the black one and the blue one, is a visual graph of INVESTOR SENTIMENT towards gold. It really is that simple. Tell me what the sentiment is towards gold, and I will tell you what the price is going to do. Why do you think we spend so much time attempting to discern the shifts in sentiment and what is driving prices?
Notice I am using the words "INVESTOR SENTIMENT". By that I mean Western investment demand, not Asian physical buying. The latter merely bottoms the gold price; it does not drive it strongly higher. That is reserved for investment demand coming from the West.
Incidentally, this is what technical analysis and study of the charts does for us - it provides a glimpse into changing sentiment. Learn to read the charts, and you will learn to gauge sentiment. You do not need to waste your money and enrich others by paying for their high-priced newsletters and putting up with their wild predictions. In my mind, too many of these hucksters cannot make a living trading so they rely on you, their carbon-based, warm-blooded hosts, to feed them and provide them with a stream of steady income. Save your money, force these human ticks to trade to earn their own living, and do your own analysis and your own thinking.
I can tell you one thing with absolute certainty - if the majority of these overpriced newsletter hustlers had to actually trade to produce an income, you would see a huge reduction in the number of wild prognostications, sensational claims, goofball theories ( backwardation claptrap always comes to my mind), and other assorted reasons for you to rush blindly into a market without having the foggiest idea of why you are putting YOUR HARD-EARNED WEALTH at risk based on the theory of someone else whom you do not know and who will still make money even if they are wrong. You, on the other hand, are the one who stands to lose. Remember that....
Posted by Trader Dan at 10:24 AM
