Midas Touch....
Final pullback should bring great buying opportunity within the next 1-3 months!
Since the top on 25th of January at 1.365 USD gold has been caught in a confusing sideways consolidation, moving between 1,305 USD and 1,365 USD back and forth. Due to the weak US-Dollar, fears of a trade war, crashing cryptomarkets and a pullback in the general stockmarket, gold bulls were able to remain in charge of the gold-market. Yet, a decisive breakout above the massive multi-year resistance between 1,350 – 1,375 USD has not happen until now. Instead gold just recently failed again at 1,365 USD and has now retreated below 1,320 USD.
Although there have been some nice short-term rallies and bounces, I am very happy that I did not send out any buy recommendation into this tricky sideways period. Our Midas Touch Gold Model™ guided us with a neutral conclusion through this consolidation.
In the bigger scheme of things, gold is still flirting with a breakout above 1,375 USD, but let´s take a systematic look before we draw any conclusions.
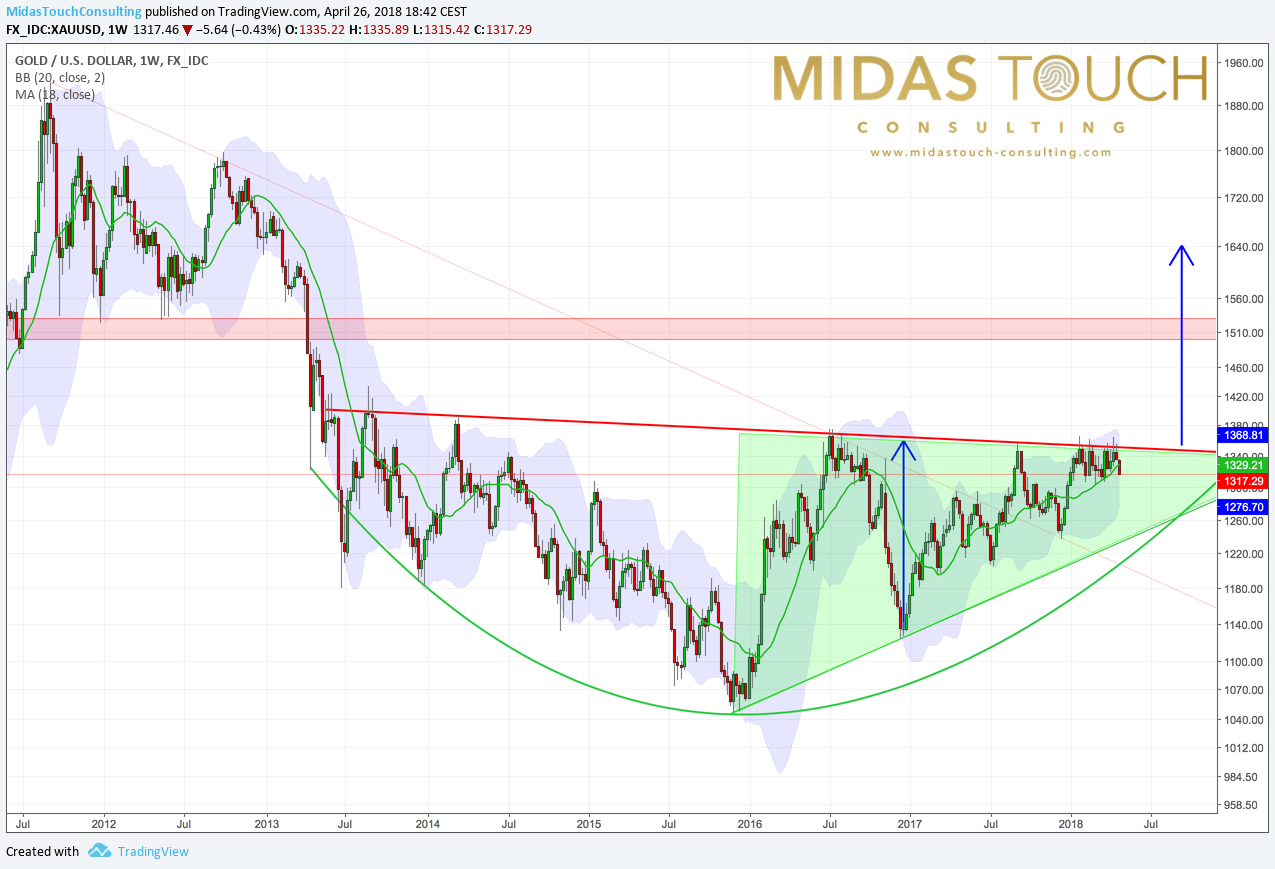
Weekly chart
On the weekly chart, gold continues to move within its large bottom building pattern. At the same time gold is moving more and more into the apex of its ascending triangle. Both formations are bullish and the probability for a breakout to the upside is definitely much higher. Timing-wise this should happen until July or August. But until that, the triangle would still offer enough room for the bears to create a painful pullback towards 1,260 USD. In this case, most traders who bought into the sideways consolidation over the last three months, would then throw in the towel. But once the gold-markt gets rid of those weak hands, we should have the perfect contrarian buying opportunity.
Of course, to profit from such a development one needs to be extremely patient and sit tight for many months! The famous quote “All of man’s problems stem from his inability to sit quietly in a room alone” is the perfect metaphor for golds challenging behavior this spring!
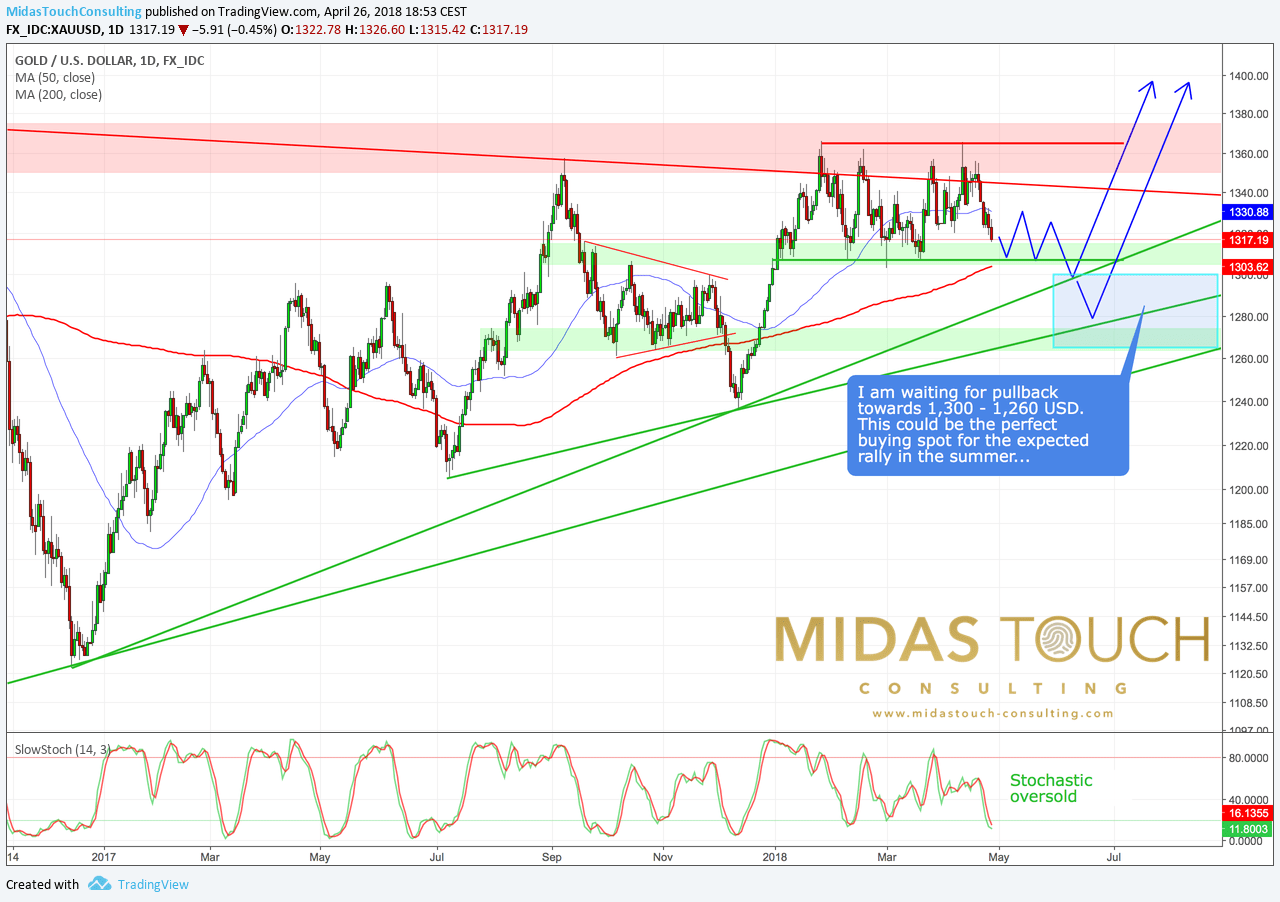
Daily chart
The daily chart zooms into the last 16 months. 13 trading days ago gold failed at the massive resistance number 1,365 USD once again. Since then we are witnessing a slow pullback, which has brought gold currently below 1,320 USD. Considering the oversold stochastic oscillator, it is very likely, that support around 1,305 USD should hold one more time and gold might bounce/recover towards 1,330 USD maybe even 1,340 USD.
But to walk the path of “greatest pain possible” a retreat below 1,300 USD is necessary. Of course a test of the rising 200-MA (1,303 USD) might actually be sufficient, but I guess we will see one more push lower, before the gold-markt is so oversold, that the large breakout rally can indeed start.
Conclusion
Although it has already been a pretty frustrating market for many trend-following traders and investors, I think gold will create even more pain in next 1-3 months. Should we indeed get a decent pullback below 1,300 USD and maybe even towards 1,260 USD, I will become a super bull again. By then sentiment and CoT-data should flash buy signals too. Until then I will continue to wait patiently at the sidelines.
Once this expected pullback/correction is done, I expect gold to have enough power to break through 1,365 USD and post a strong and fast rally towards 1,525 USD until the end of 2018 or latest March 2019.