Ik volg al jaren een commodity trader (dus geen specifieke goudboer, maar een trader in soft-commodities; energy; base metals en daarnaast ook precious), die het allemaal plots wat extremer ziet dan ik .... ook al is die trader over de jaren heen normaal gesproken behoudend ten opzichte van de goudprijs. En juist die trader post nu dit ....
Technische Analyse, daytrading en speculatie draad 2013
-
Indiana Jones

- Freegold Member
- Posts: 4765
- Joined: 05 Oct 2011, 16:00
- Contact:
Re: Technische Analyse, daytrading en speculatie draad 2013
Je hebt bovenstaand goldstreaming gepost, dus het oorspronkelijke plaatje is reeds verdwenen. 
Ik volg al jaren een commodity trader (dus geen specifieke goudboer, maar een trader in soft-commodities; energy; base metals en daarnaast ook precious), die het allemaal plots wat extremer ziet dan ik .... ook al is die trader over de jaren heen normaal gesproken behoudend ten opzichte van de goudprijs. En juist die trader post nu dit ....
Ik volg al jaren een commodity trader (dus geen specifieke goudboer, maar een trader in soft-commodities; energy; base metals en daarnaast ook precious), die het allemaal plots wat extremer ziet dan ik .... ook al is die trader over de jaren heen normaal gesproken behoudend ten opzichte van de goudprijs. En juist die trader post nu dit ....
- Attachments
-
- gold_1.png (47.04 KiB) Viewed 6663 times
Everything that needs to be said has already been said.
But since no one was listening, everything must be said again.
But since no one was listening, everything must be said again.
-
Indiana Jones
- Freegold Member
- Posts: 4765
- Joined: 05 Oct 2011, 16:00
- Contact:
Re: Technische Analyse, daytrading en speculatie draad 2013
En dan nog even dit, van King World News: .... 
- Attachments
-
- KWN%20Wides%203%20.jpg (134.47 KiB) Viewed 6660 times
Everything that needs to be said has already been said.
But since no one was listening, everything must be said again.
But since no one was listening, everything must be said again.
-
Spruitje

- Freegold Member
- Posts: 2581
- Joined: 19 Oct 2011, 01:34
Re: Technische Analyse, daytrading en speculatie draad 2013

Study while others are sleeping; work while others are loafing; prepare while others are playing; and dream while others are wishing.
- William Arthur Ward -
- William Arthur Ward -
-
Indiana Jones
- Freegold Member
- Posts: 4765
- Joined: 05 Oct 2011, 16:00
- Contact:
Re: Technische Analyse, daytrading en speculatie draad 2013
Zelfs Lars Lindgren (gullprat.no) ziet het weer helemaal zitten.
Zelf ben ik wat voorzichtiger, 'mijn wig' sluit pas tegen eind 2013.

Zelf ben ik wat voorzichtiger, 'mijn wig' sluit pas tegen eind 2013.
Everything that needs to be said has already been said.
But since no one was listening, everything must be said again.
But since no one was listening, everything must be said again.
-
Indiana Jones
- Freegold Member
- Posts: 4765
- Joined: 05 Oct 2011, 16:00
- Contact:
Re: Technische Analyse, daytrading en speculatie draad 2013
Trader Dan's Market Views
Market Insights and News
Saturday, February 9, 2013
Federal Reserve Balance Sheet - A Proxy for US Equity Markets
If there are still any skeptics left out there who DO NOT BELIEVE that the entire stock market rally from its low made back in late 2008, has been engineered by the Federal Reserve, then please examine the following chart I have constructed using the data from the Fed's own site which provides a weekly glimpse into their balance sheet.
Note that I am only using the total of their Securities holdings and not the entirety of the data that goes into constructing the overall size of the balance sheet. In other words, I am excluding loans from the Discount Window, swaps and other assets that go into making up the entirety of their available credit. In other words, I am being "conservative". If you take those other factors into account, the size of the balance sheet of the Fed is already over $3 TRILLION!
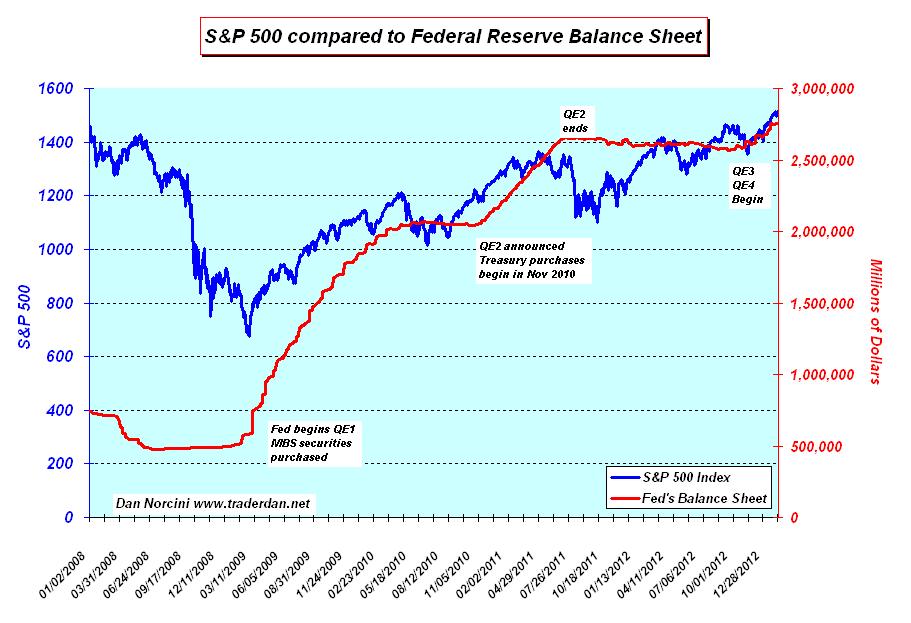
Even at this, it still provides a very compelling picture of why US equities continue to plumb new highs nearly month after month in spite of the anemic at best growth in the underlying economy.
I maintain that the Fed has engineered one of the most massive bouts of INFLATION in the STOCK MARKET since its inception a century ago. Can you see the connection between the overall size of the Fed's Balance Sheet and the level of the S&P 500?
This is by design of course since in our new, modern age of ignorance, these monetary wizards believe that they can create lasting prosperity by forcing untold amounts of freshly minted liquidity into stocks jamming those prices higher and thereby influencing consumer sentiment. A rising stock market provides cover for all manner of other economic woes, and political woes, I might add. The low information citizen takes one look over at the DOW or the S&P 500 and then falsely assumes that all is well with the world and then goes about his or her business without delving any deeper into these matters. This is of course further propagated by the blind lemmings who constitute the majority of analysts out there on financial TV who breathlessly talk about the wonderful rally in stocks heralding the beginning of solid, sustained economy vitality. Idiots! (Sorry, I could not help myself on this one).
The opposite is true when stock prices are collapsing. Consumers begin to move from concern, to worry, to fear and to outright panic and then most worrisome to the elites, anger as they look for scapegoats.
As I have stated many times now on this site, if it was this easy to create prosperity, it would have been figured out a long, long time ago by previous generations, which unlike this current one, were actually capable of critical analysis. Let's call this current Federal Reserve strategy: "PROSPERITY IN A BOTTLE". It is akin to a cologne for men. Just splash some on and forego the shower for the time being as the aroma masks the smell from a day's perspiration.
What the Fed has done is to cover up the stench from the debt overload and rampant speculation its policies have created in our financial system. The deeply-rooted structural issues have been left unblemished in their vigor.
Do not forget this one thing - ultra low interest rates benefit TWO GROUPS at the EXPENSE OF SAVERS.
FIRST - the borrower and
SECOND - the large speculator/hedge fund which borrows money for basically no cost and then LEVERAGES that money in speculative bets. Where do you think all that liquidity that the Fed has shoved into the marketplace has gone???? the answer - into equities!
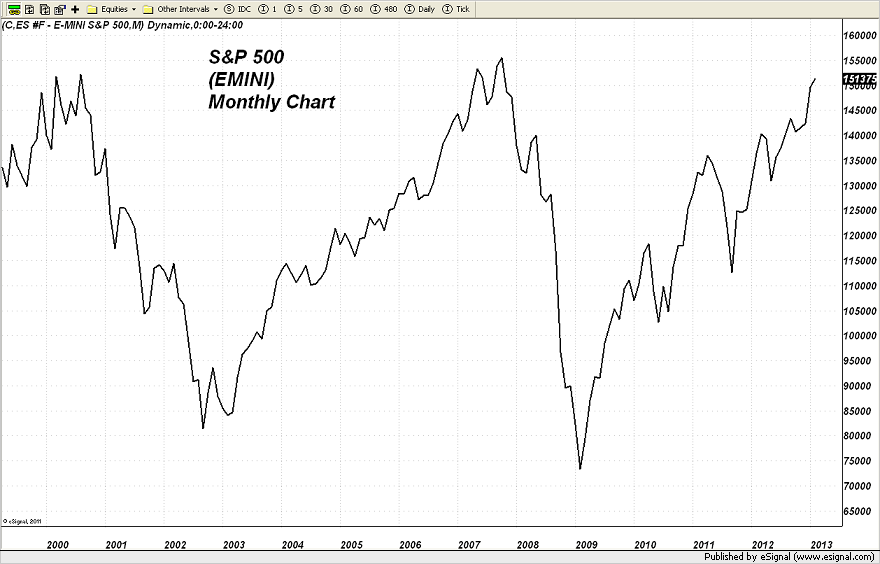
Lastly, here is one more look at the level of the S&P 500 seen through the prism of gold. First look at the S&P in NOMINAL TERMS. Note that the Fed's machinations have jammed it to within a whisker's breadth of its all time CLOSING HIGH made back in late 2007 just before the bottom dropped out of the index and it lost 50% of its value over the next year and a half. "Wonderful, Superb, Splendid, Impressive" all are adjectives being used to describe the "recovery" in stock prices.
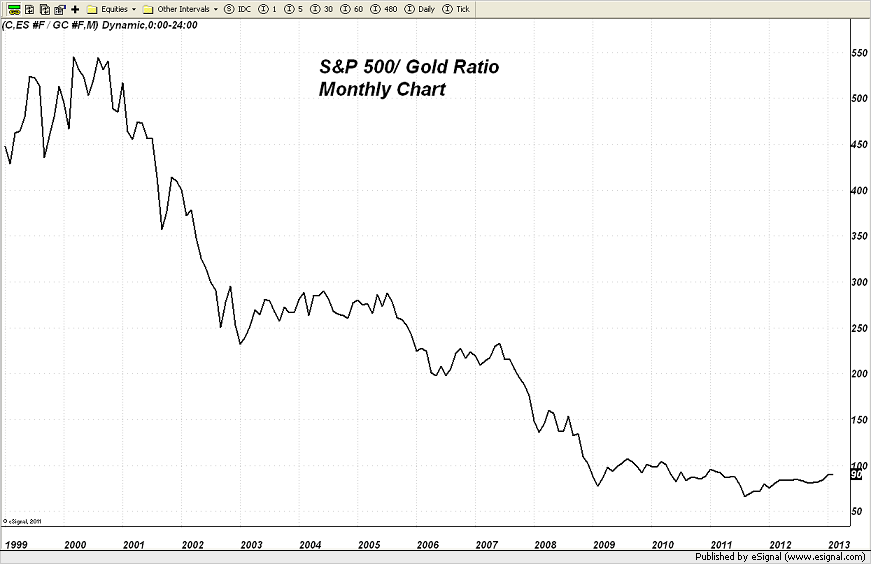
Now take a look at the same chart when the price level of the S&P 500 index is compared to the value of one ounce of gold. Note that "recovery" seen in the nominal index off the 2009 low doesn't seem like all that much now does it? Translation from all this - Fed induced RAMPANT INFLATION OF PAPER ASSETS; nothing more. Traders of course can go with the flow of money into equities as long as they do not mistake this equity rally as the herald of a new era of lasting prosperity. When the music finally does stop, and the players rush to find their chairs, many are going to be left standing looking for a place to sit and coming up empty.
Posted by Trader Dan at 10:05 AM
http://www.traderdannorcini.blogspot.nl ... y-for.html
Market Insights and News
Saturday, February 9, 2013
Federal Reserve Balance Sheet - A Proxy for US Equity Markets
If there are still any skeptics left out there who DO NOT BELIEVE that the entire stock market rally from its low made back in late 2008, has been engineered by the Federal Reserve, then please examine the following chart I have constructed using the data from the Fed's own site which provides a weekly glimpse into their balance sheet.
Note that I am only using the total of their Securities holdings and not the entirety of the data that goes into constructing the overall size of the balance sheet. In other words, I am excluding loans from the Discount Window, swaps and other assets that go into making up the entirety of their available credit. In other words, I am being "conservative". If you take those other factors into account, the size of the balance sheet of the Fed is already over $3 TRILLION!
Even at this, it still provides a very compelling picture of why US equities continue to plumb new highs nearly month after month in spite of the anemic at best growth in the underlying economy.
I maintain that the Fed has engineered one of the most massive bouts of INFLATION in the STOCK MARKET since its inception a century ago. Can you see the connection between the overall size of the Fed's Balance Sheet and the level of the S&P 500?
This is by design of course since in our new, modern age of ignorance, these monetary wizards believe that they can create lasting prosperity by forcing untold amounts of freshly minted liquidity into stocks jamming those prices higher and thereby influencing consumer sentiment. A rising stock market provides cover for all manner of other economic woes, and political woes, I might add. The low information citizen takes one look over at the DOW or the S&P 500 and then falsely assumes that all is well with the world and then goes about his or her business without delving any deeper into these matters. This is of course further propagated by the blind lemmings who constitute the majority of analysts out there on financial TV who breathlessly talk about the wonderful rally in stocks heralding the beginning of solid, sustained economy vitality. Idiots! (Sorry, I could not help myself on this one).
The opposite is true when stock prices are collapsing. Consumers begin to move from concern, to worry, to fear and to outright panic and then most worrisome to the elites, anger as they look for scapegoats.
As I have stated many times now on this site, if it was this easy to create prosperity, it would have been figured out a long, long time ago by previous generations, which unlike this current one, were actually capable of critical analysis. Let's call this current Federal Reserve strategy: "PROSPERITY IN A BOTTLE". It is akin to a cologne for men. Just splash some on and forego the shower for the time being as the aroma masks the smell from a day's perspiration.
What the Fed has done is to cover up the stench from the debt overload and rampant speculation its policies have created in our financial system. The deeply-rooted structural issues have been left unblemished in their vigor.
Do not forget this one thing - ultra low interest rates benefit TWO GROUPS at the EXPENSE OF SAVERS.
FIRST - the borrower and
SECOND - the large speculator/hedge fund which borrows money for basically no cost and then LEVERAGES that money in speculative bets. Where do you think all that liquidity that the Fed has shoved into the marketplace has gone???? the answer - into equities!
Lastly, here is one more look at the level of the S&P 500 seen through the prism of gold. First look at the S&P in NOMINAL TERMS. Note that the Fed's machinations have jammed it to within a whisker's breadth of its all time CLOSING HIGH made back in late 2007 just before the bottom dropped out of the index and it lost 50% of its value over the next year and a half. "Wonderful, Superb, Splendid, Impressive" all are adjectives being used to describe the "recovery" in stock prices.
Now take a look at the same chart when the price level of the S&P 500 index is compared to the value of one ounce of gold. Note that "recovery" seen in the nominal index off the 2009 low doesn't seem like all that much now does it? Translation from all this - Fed induced RAMPANT INFLATION OF PAPER ASSETS; nothing more. Traders of course can go with the flow of money into equities as long as they do not mistake this equity rally as the herald of a new era of lasting prosperity. When the music finally does stop, and the players rush to find their chairs, many are going to be left standing looking for a place to sit and coming up empty.
Posted by Trader Dan at 10:05 AM
http://www.traderdannorcini.blogspot.nl ... y-for.html
Everything that needs to be said has already been said.
But since no one was listening, everything must be said again.
But since no one was listening, everything must be said again.
-
Indiana Jones
- Freegold Member
- Posts: 4765
- Joined: 05 Oct 2011, 16:00
- Contact:
Re: Technische Analyse, daytrading en speculatie draad 2013
Ça commence avec toi ....
p.s. ik heb deze grafiek nergens vandaan, het is mijn eigen gemaakte grafiek waar ik op koers !
- Attachments
-
- Goud.jpg (164.27 KiB) Viewed 6536 times
Everything that needs to be said has already been said.
But since no one was listening, everything must be said again.
But since no one was listening, everything must be said again.
-
Indiana Jones
- Freegold Member
- Posts: 4765
- Joined: 05 Oct 2011, 16:00
- Contact:
Re: Technische Analyse, daytrading en speculatie draad 2013
Aangevuld met de 3th wave theorie van Alf Field uit november 2011
In ieder geval heb ik mijn stoploss op die Alf Field Line geplot, omdat ik vanwege de volatiliteit in goud niet hoger durf te gaan ...
In ieder geval heb ik mijn stoploss op die Alf Field Line geplot, omdat ik vanwege de volatiliteit in goud niet hoger durf te gaan ...
- Attachments
-
- Goud.jpg (139.12 KiB) Viewed 6521 times
Everything that needs to be said has already been said.
But since no one was listening, everything must be said again.
But since no one was listening, everything must be said again.
-
Indiana Jones
- Freegold Member
- Posts: 4765
- Joined: 05 Oct 2011, 16:00
- Contact:
Re: Technische Analyse, daytrading en speculatie draad 2013
1605 staat op Armstrong/s lijstje (short term reversal) en daar luistert Indy toch wel naar. Bij mij 1606 ..... .
De volgende op Armstrong/s lijstje zijn 1522 en 1409 (bij mij resp 1521 en 1412) en ook dáárin luister ik naar Armstrong.
Denk niet dat goud daaronder (1412) nog gaat komen, maar misschien nog wel onder de 1606 resp 1521 .... zeg nooit, nooit ! Dan is mijn triangel weliswaar gebroken, maar de uptrend van Alf Field nog intact.
We gaan zien ..........
Indy
Everything that needs to be said has already been said.
But since no one was listening, everything must be said again.
But since no one was listening, everything must be said again.
-
Indiana Jones
- Freegold Member
- Posts: 4765
- Joined: 05 Oct 2011, 16:00
- Contact:
Re: Technische Analyse, daytrading en speculatie draad 2013
Indy/s T.A.
Let op: de huidige slotstand (vrijdag 15/2) is een kritische, namelijk een short term reversal point. Zoals ik gisteren al schreef (en Armstrong veel eerder al). Het kan dus komende weken nog lager gaan. Of dat gebeurt, weet ik niet, maar het kan dus!
Doe ermee, wat je niet laten kunt .......
Laat, wat je niet doen kunt ......
prettig weekend,
Indy
- Attachments
-
- Goud, 15 februari 2013.gif (79.02 KiB) Viewed 6451 times
Everything that needs to be said has already been said.
But since no one was listening, everything must be said again.
But since no one was listening, everything must be said again.
-
Indiana Jones
- Freegold Member
- Posts: 4765
- Joined: 05 Oct 2011, 16:00
- Contact:
Re: Technische Analyse, daytrading en speculatie draad 2013
Friday, February 15, 2013
Speculative Money Flowing out of 'Paper' Gold
This afternoon's (Friday) Commitment of Traders report confirms what I have been discussing here on this site as well as in my audio interviews over at King World News Metals Wrap, namely, that the Central Banks have managed to curtail speculative money flows into Gold and direct those money flows into equities.
This is the reason gold cannot find much in the way of traction to the upside and cannot mount any sustained moves higher. Quite simply, big specs are using rallies into resistance to unload stale longs and put on new shorts. Now that near term momentum has shifted to the downside, they are also selling into weakness and pressuring the metal even lower.
Notice that since October of last year, hedge funds have been steadily liquidating long positions in the gold market while simultaneously instituting brand new short positions. The result of money flows out of the gold market that began in that month, in addition to fresh shorting, has sent the gold price down $116/ounce as of Tuesday of this week, when the data for the COT is captured by the CFTC. Gold has since fallen another $39 as of Friday so one can assume that further long liquidation has been taking place by hedge funds along with another fresh burst of short selling by this same group of traders. Another way of saying this is that gold has fallen $155/ounce since this movement or repositioning by large hedge funds has occured in earnest.
I should also note that this is the LARGEST outright short position by hedge funds in Five Years.... that is quite remarkable to say the least.
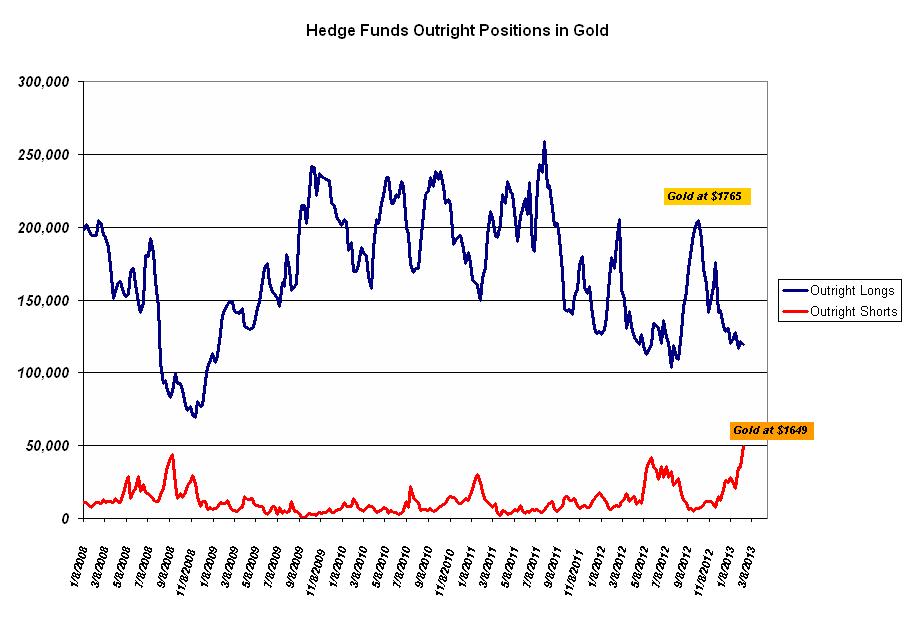
Right now the story remains the same - the Central Banks of the West (Japan is included) have managed to pull off one helluva feat by corraling the hedge funds out of commodities (and gold) and into equities, the only game in town to capture any decent yield on investment in this pathetically low, near zero , interest rate environment that they have created.
As far as downside in gold goes, today's low will serve as the initial level of chart support as handle of "15" will serve to attract some value-based buying as it has been a while since we have seen that price. If the market cannot hold there, I see some light chart support near $1585 or so. Below that, $1560 and then $1545.
The HUI looks beyond pathetic. Barrick announced that they will be selling off some non-productive assets and properties, etc, to streamline their operations and reduce costs. That is a very good sign that some of these mining CEO's are getting the message from the market: "Get your financial house in order and get costs under control so that you can return value to stockholders or else...". It is a pity that it has taken a beating of this severity to wake some of these guys up. One last thing - be selective about which gold companies you want to own. Make sure that management is serious about running a tight ship.
Posted by Trader Dan at 9:30 PM
Speculative Money Flowing out of 'Paper' Gold
This afternoon's (Friday) Commitment of Traders report confirms what I have been discussing here on this site as well as in my audio interviews over at King World News Metals Wrap, namely, that the Central Banks have managed to curtail speculative money flows into Gold and direct those money flows into equities.
This is the reason gold cannot find much in the way of traction to the upside and cannot mount any sustained moves higher. Quite simply, big specs are using rallies into resistance to unload stale longs and put on new shorts. Now that near term momentum has shifted to the downside, they are also selling into weakness and pressuring the metal even lower.
Notice that since October of last year, hedge funds have been steadily liquidating long positions in the gold market while simultaneously instituting brand new short positions. The result of money flows out of the gold market that began in that month, in addition to fresh shorting, has sent the gold price down $116/ounce as of Tuesday of this week, when the data for the COT is captured by the CFTC. Gold has since fallen another $39 as of Friday so one can assume that further long liquidation has been taking place by hedge funds along with another fresh burst of short selling by this same group of traders. Another way of saying this is that gold has fallen $155/ounce since this movement or repositioning by large hedge funds has occured in earnest.
I should also note that this is the LARGEST outright short position by hedge funds in Five Years.... that is quite remarkable to say the least.
Right now the story remains the same - the Central Banks of the West (Japan is included) have managed to pull off one helluva feat by corraling the hedge funds out of commodities (and gold) and into equities, the only game in town to capture any decent yield on investment in this pathetically low, near zero , interest rate environment that they have created.
As far as downside in gold goes, today's low will serve as the initial level of chart support as handle of "15" will serve to attract some value-based buying as it has been a while since we have seen that price. If the market cannot hold there, I see some light chart support near $1585 or so. Below that, $1560 and then $1545.
The HUI looks beyond pathetic. Barrick announced that they will be selling off some non-productive assets and properties, etc, to streamline their operations and reduce costs. That is a very good sign that some of these mining CEO's are getting the message from the market: "Get your financial house in order and get costs under control so that you can return value to stockholders or else...". It is a pity that it has taken a beating of this severity to wake some of these guys up. One last thing - be selective about which gold companies you want to own. Make sure that management is serious about running a tight ship.
Posted by Trader Dan at 9:30 PM
Everything that needs to be said has already been said.
But since no one was listening, everything must be said again.
But since no one was listening, everything must be said again.